Factory Automation Dashboard: Give Operators Information They Can Act On
TL;DR: A factory automation dashboard should help a named person make a specific production decision using understandable, current information. Begin with reliable monitoring, clear states and a tested response to missing data before considering machine commands. Webbies can connect hardware, software and the operator journey as one project.
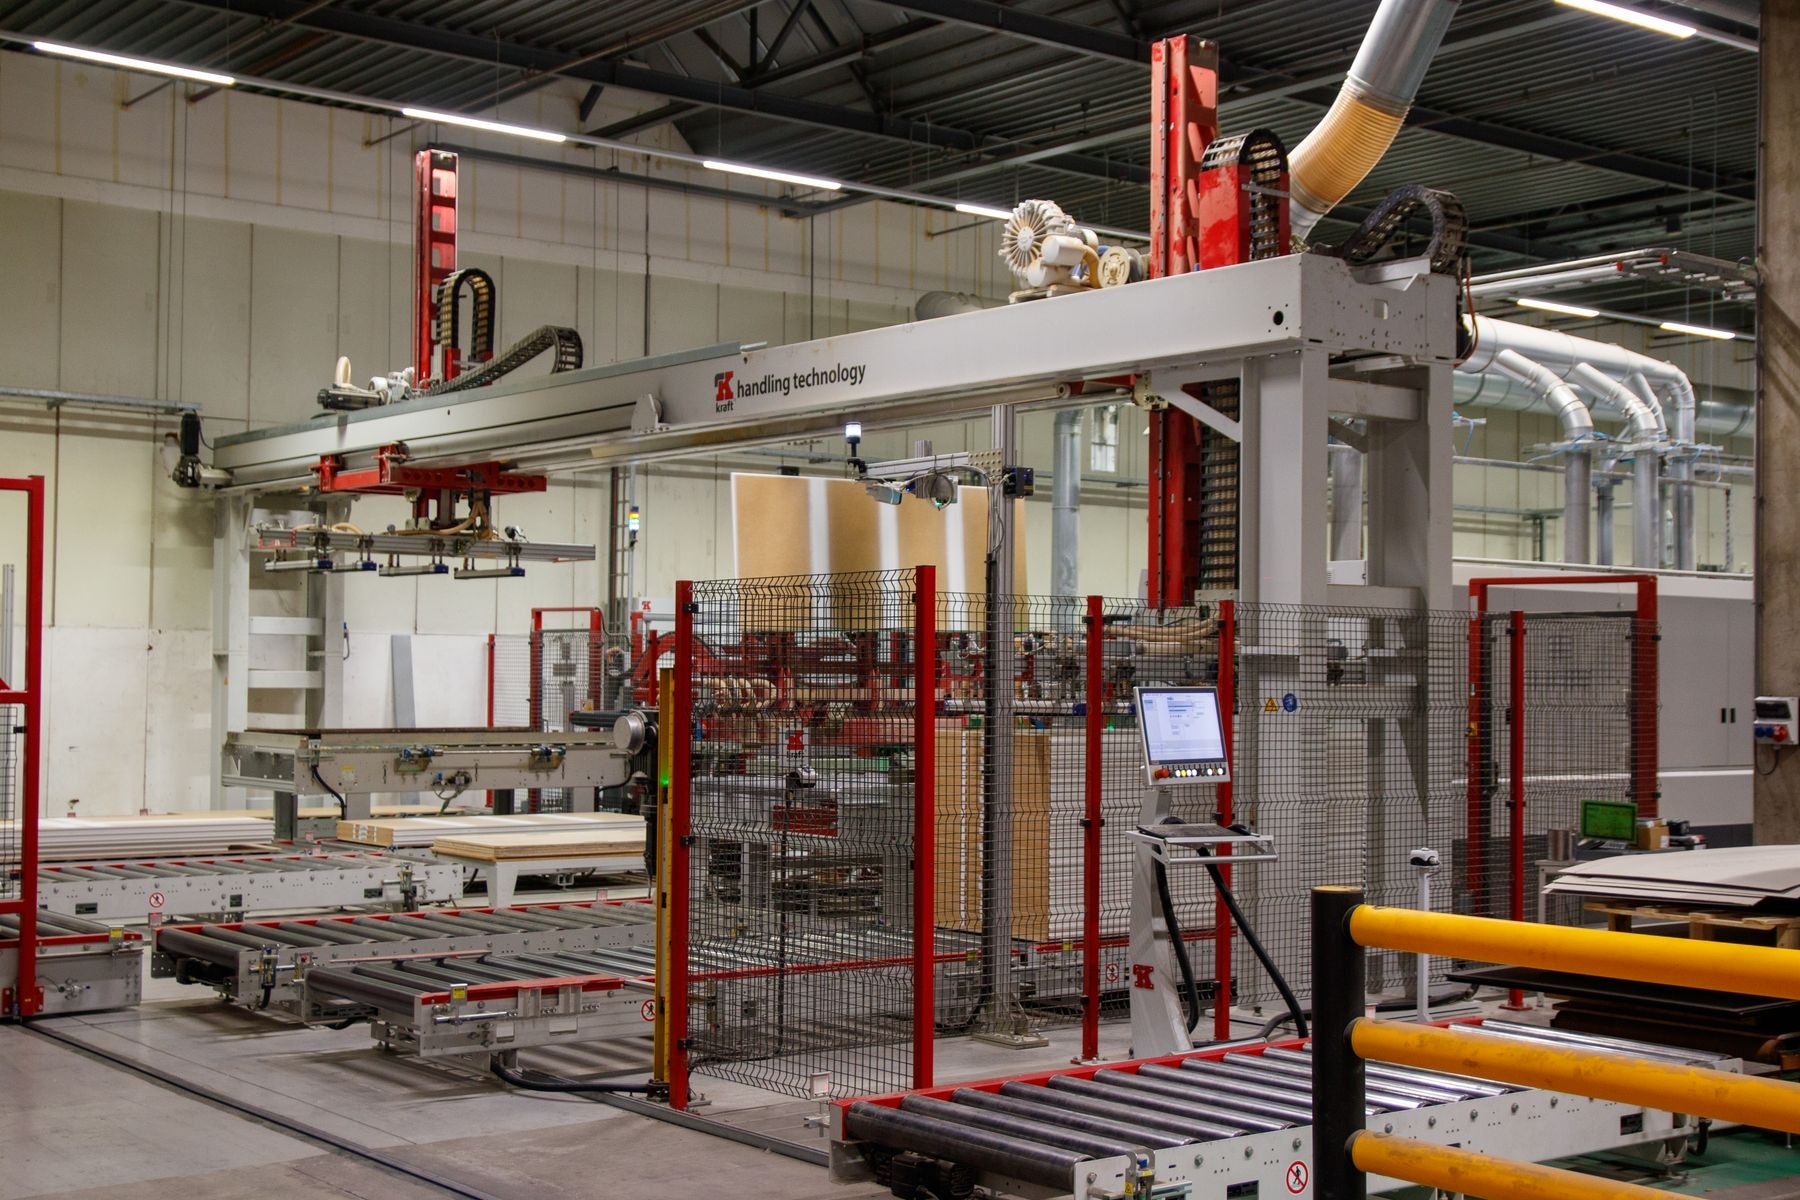
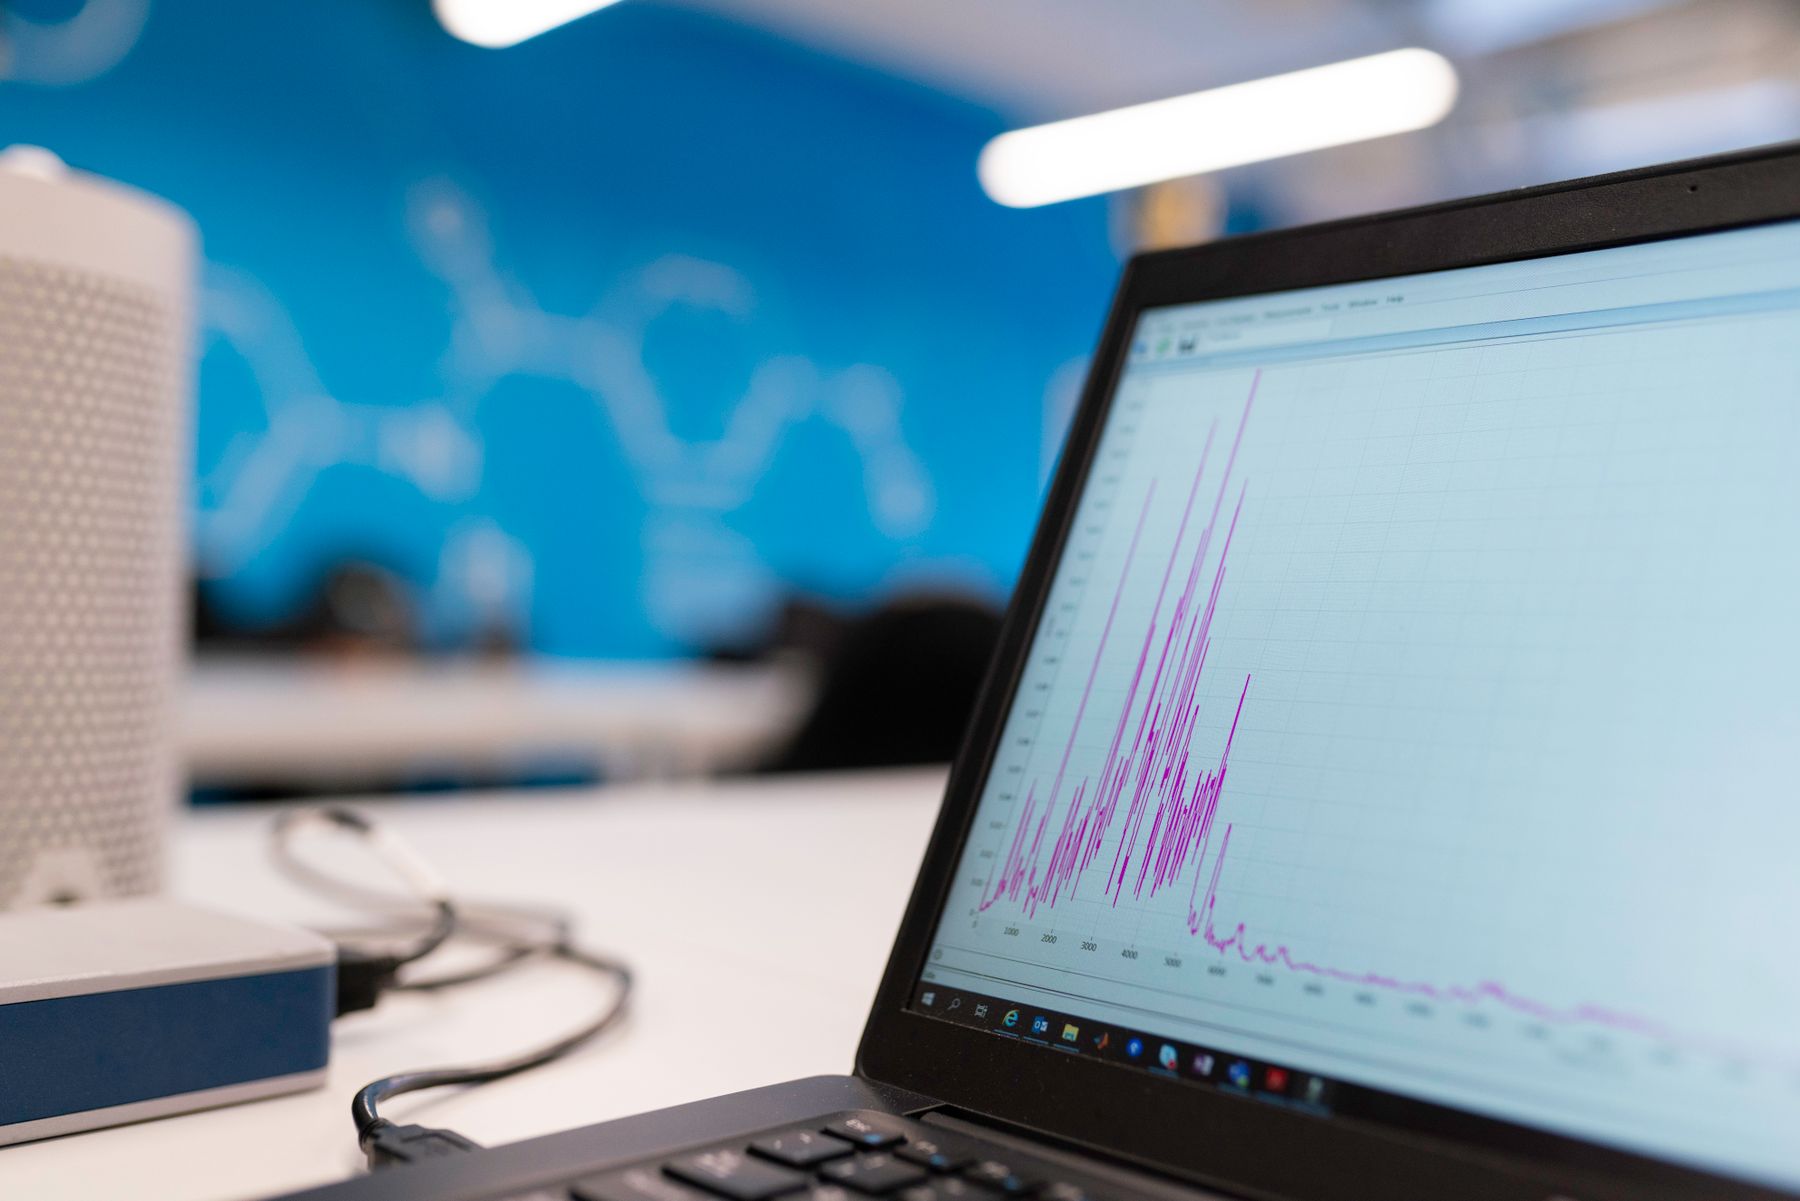
Illustrative photography by Freek Wolsink / Pexels.
Introduction
Your production team has numbers on several screens but still calls someone to explain what is happening. A factory automation dashboard is useful when it reduces that uncertainty and makes the next action clear.
For a manufacturer, the starting question is not how many charts will fit on a large screen. It is which decision is delayed, what information is needed and who is responsible for responding. That might be checking a stopped process, reviewing a shift or investigating an unexpected count.
Webbies’ Engg Plastic project covers hardware and software integration for automation in a plastic cup factory. Its documented scope connects the physical production process with digital information and operator needs. This article extends that context into a practical planning guide, without assuming undocumented machinery, protocols or performance results.
What Is a Factory Automation Dashboard
A factory automation dashboard is an interface that brings production-system information together so people can understand status and make defined operating decisions.
Some dashboards only display information. Others include controls, acknowledgements or links into maintenance and production workflows. Those are different responsibilities and should be scoped separately. A screen that monitors a process does not automatically have the authority or engineering safeguards to control it.
A production monitoring dashboard also needs context: which line or machine a value belongs to, when it was observed and whether the connection is healthy. A precise-looking number without that context can be less helpful than a clear message that the information is unavailable.
Why More Charts Do Not Always Help
Start by looking for problems the team already recognises:
- Different shifts interpret the same status differently.
- Staff cannot distinguish a stopped process from a lost connection.
- Values appear current even when updates have stopped.
- An alert appears without an agreed response or owner.
- Managers see totals without understanding the relevant operating period.
These problems affect the usefulness of information before they affect visual design. The opportunity is to support faster, better-informed decisions, but improvements should be measured against a baseline rather than promised as a fixed reduction in downtime.
How to Plan a Dashboard Around the Operator
Write the decision before choosing the metric
Name the person using the screen and the decision they need to make. For example, a shift supervisor might need to identify which line requires a check. List the information that supports that action and remove measures that nobody can explain or use.
Define every important term. Does a count represent items detected, accepted products or completed packs? What marks the start and end of a shift? Agreement on those definitions is part of the product brief, not a detail to postpone until installation.
Separate monitoring from control
| Interface scope | What it supports | Planning question |
|---|---|---|
| Monitoring | Understanding status and trends | Is the information reliable and clearly labelled? |
| Operator workflow | Recording an acknowledgement or investigation | Who acts, and what record is kept? |
| Equipment control | Issuing a command to a physical process | What engineering review and safeguards are required? |
Use this distinction when discussing the first release. NIST’s operational-technology guidance recognises the performance, reliability and safety considerations of systems connected to physical processes. A dashboard brief should be reviewed with the people responsible for that environment.
Make data quality visible
Show the time of the last useful update, not just a decorative connection icon. Explain missing, delayed and unavailable information in words as well as colour. Keep the difference between zero production and no data unmistakable.
Test what happens when the connection returns. The screen should explain whether values were recovered, whether a gap remains and which period a chart covers. The details depend on the integration; the interface must not invent certainty that the underlying system cannot provide.
Design the response with the team
An alert needs an operating meaning. Agree what triggers it, who reviews it and how the team distinguishes a new issue from one already being investigated. Avoid filling a screen with warnings that the staff learn to ignore.
Include shift handover in testing. Ask the next person to explain the current state using only the information available in the interface. If they need a separate verbal explanation for every exception, the dashboard may be missing essential context.
How Webbies can help
Webbies’ Engg Plastic work treats hardware integration and the factory’s digital information as connected parts of the same project. That experience is relevant to scoping an industrial IoT interface around the environment and the people using it.
Webbies can help map the information flow, define interface states and develop a dashboard or application around agreed operator tasks. Your equipment specialists and operating team should remain involved in integration and acceptance decisions. Start with our IoT services, then define the responsibilities of each team in the brief.
Practical Steps for a Pilot
- Choose one operating decision and a named user. Observe how the team makes that decision today.
- Identify the information source and owner. Record what each value means and when it is considered current.
- Prototype normal, stopped and disconnected states. Ask operators to explain the difference without assistance.
- Review the integration with the responsible technical team. Keep monitoring and equipment-control requirements explicit.
- Test an entire shift and handover. Include missing information and recovery, not only a successful connection.
- Compare the pilot with the baseline. Review useful decisions, unresolved alerts and support effort before expanding.
Common Mistakes to Avoid
- Treating missing data as zero.
- Using colour as the only explanation of status.
- Mixing several definitions of the same production metric.
- Adding controls without a separate engineering review.
- Launching alerts without an owner or response process.
Frequently Asked Questions
Does a factory automation dashboard need to control machines?
No. A monitoring interface can be a useful first scope; issuing commands to equipment introduces additional responsibilities that need explicit review.
What should a production monitoring dashboard show first?
Show the information needed for a specific operator decision, together with its source and freshness. The right first screen depends on the task and production environment.
Can an industrial IoT interface work with existing equipment?
Potentially, if suitable data access and integration options exist. Assess the actual equipment and responsibilities before committing to a particular architecture.
What affects the cost and timing?
Integration access, data quality, operating conditions, interface scope and acceptance testing all affect delivery. A limited pilot helps expose these dependencies.
Will a dashboard automatically reduce downtime?
No. The information must lead to an appropriate operating response, and equipment or process issues may require separate changes. Measure the decisions the dashboard supports before claiming an improvement.
Conclusion
A useful dashboard turns production information into a clear decision for a real person. Define the meaning of the data, make uncertainty visible and test the response with the operating team. Discuss a focused factory-information pilot with Webbies.
Related Webbies services and projects
Sources and further reading
- NIST Guide to Operational Technology Security provides background on the distinctive requirements of systems connected to physical processes.
Plan your project with Webbies
Bring one operator task, the available equipment information and a sample shift report to Webbies to scope the first useful interface.